
Performance indicators
Performance indicators show which agreements have been made with regard to the performance of an object. Such indicators are also referred to as Key Success Factors or Process indicators.
A Performance indicator is used to monitor the results of a Process or of a series of Processes.
A well-defined Performance indicator answers the questions:
- Why do we measure?
- About which Process chain or Process does it say something?
- Where in the Process do we measure and where do we report?
- What are the definitions of parameters, formulas, scales, and limits?
- What scenarios are available when the Performance indicator exceeds a threshold?
Performance is measured in the Process against the Process input and output and may be reported elsewhere in, for example, a management process.
Performance indicators say something about:
- The functioning, well-being, and development of the Process.
- The status and development of the process result.
- The effect of the process result for the various stakeholders.
- The scenarios that can be followed in the event of deviating results.
To make the above relationship visible, Performance indicators are linked to one or more objects of the following type:
- The Process input and output, the information flows against which is measured and where is reported.
Note: measurements can take place at completely different locations in the entire process and still provide a correct and complete picture of a particular process. - The Process chain, the report of which provides useful management information for directors and managers to effectively test, develop and apply their policies and behavior.
- The Process, about which the report provides useful management information for directors, managers, administrators, and executive employees to effectively test, develop and apply their policy and behavior.
Documents and links
The management system here contains the qualitative definitions and specifications of the Performance indicator, the standards or limit values that are tested, and further explanation about the handling of the reports.
It is also possible that the links with tools and automation systems for the numerical or quantitative registration, processing, reporting, and presentation are shown here. The Documents and links can be used to access the numerical reports or the numerical reporting environment. A simple quantitative System can consist of a spreadsheet. Advanced programs can also be linked for numerical implementation, data collection, and processing, reporting, and follow-up. These Systems are often related to your administrative environment. Separate specialized Systems may also be linked for performance management and the balanced scorecard.
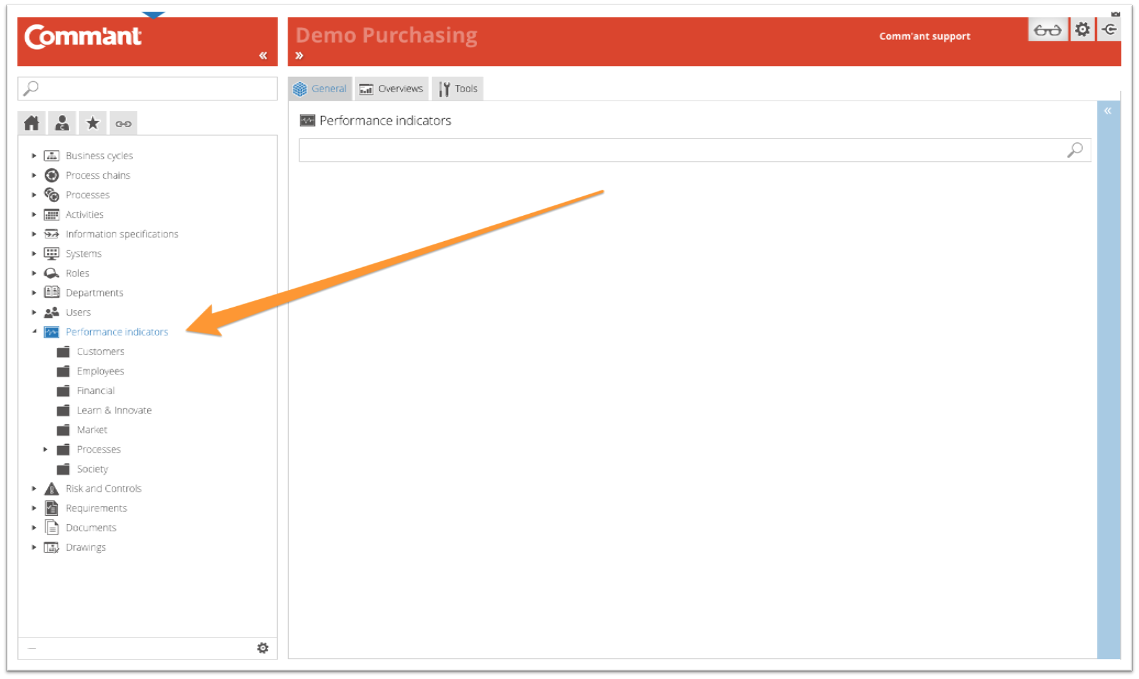
Folder structure/groups
The folder structure is built around the types of Performance indicators created within the organization.
Type Performance indicators
There are different types of Performance Indicators. These may be grouped accordingly. The basic principle is that it makes a meaningful contribution to the integral management and control of the Processes that influence and produce these results.
Examples of groups of Performance indicators:
- Customer indicators
- Market indicators
- Financial indicators
- Social indicators
- Personnel indicators
- Process Indicators
- Innovation indicators
When you click on a folder or group of Performance indicators, the tree structure opens and at the same time, Comm’ant shows the contents of the folder in question on the Main screen. You select the contents of the folder by either clicking on a Performance indicator in the tree structure or in the Main screen.
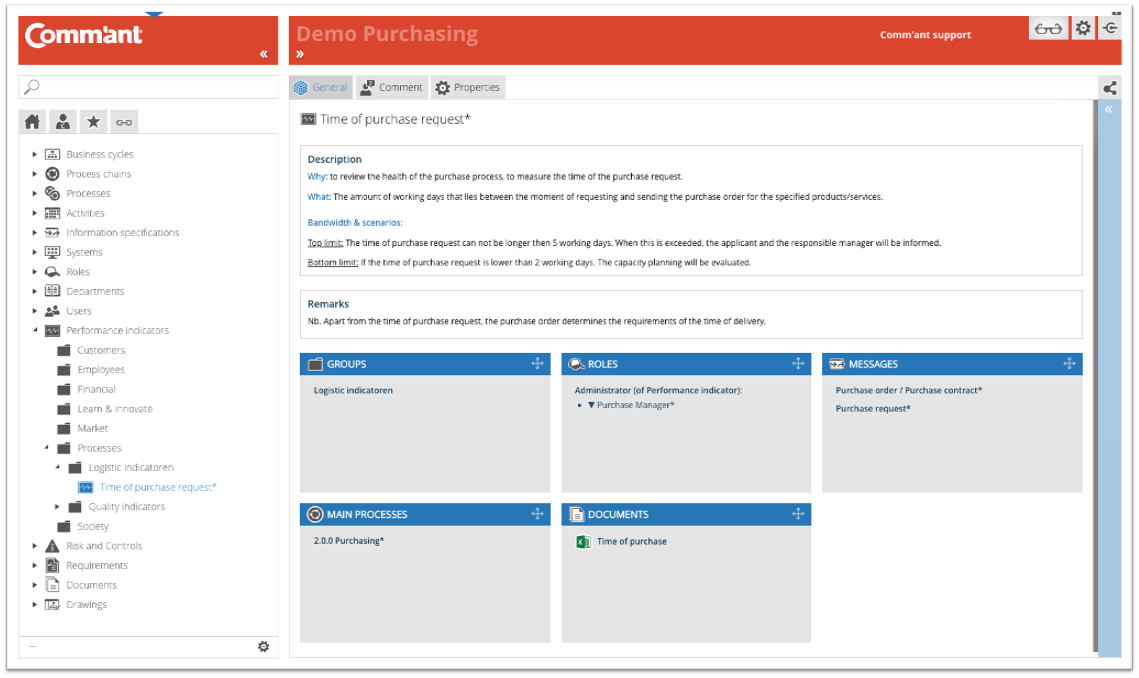
Selected Performance Indicator
After selecting, the Main screen shows more detailed information about the Performance indicator.
Note:
These fields are only shown when they contain information.
Name
The name of the Performance indicator.
Remarks
If remarks are included with the Performance Indicator, they will be displayed.
Comments
If a comment is included with the Performance Indicator, it will be displayed.
Boxes
At the bottom are the boxes that show which attributes are linked to the Performance indicator. These boxes show the attribute title in the top bar with the specific attributes below. These blue boxes represent the attributes that are directly associated with the Performance Indicator.
By clicking once on the top bar, all boxes are minimized or maximized. Clicking the same spot again has the opposite effect.
Connections of a selected Performance indicator
Just above the Navigation menu is the button that opens the Links-tab. This button shows the Links menu instead of the Navigation menu; an overview of the direct and indirect links of a selected Performance indicator with other objects:
| Links to | Links how |
| Process chains | directly |
| Processes | directly |
| Information flows | directly |
| Roles and positions | direct on Performance indicator |
| Documents | directly |
Note: The Links button ![]() has two options: Linked objects and Dynamic links.
has two options: Linked objects and Dynamic links.
- With ‘Dynamic links menu’
 enabled, the links menu will alter every time a different element is displayed on the Main screen.
 - With ‘Linked objects menu’
 enabled, the links menu will remain the same regardless of what is displayed on the Main screen.
The default setting of this button is the ‘Linked objects menu’, but hovering over the button enables you to select ‘Dynamic links menu’ as well. With ‘Dynamic links menu’ enabled, the icon gets an asterisk for recognition: ![]() .
.